About Stock Market Sector Indexes
Intraday indexes calculated from real time market data. New data matrixes for all the indexes including EPS, P/E, short ratio … and much more. The US Market Indexes publication from Bull Laboratories (BullLabs.com) is a...
Intraday indexes calculated from real time market data. New data matrixes for all the indexes including EPS, P/E, short ratio … and much more.
The US Market Indexes publication from Bull Laboratories (BullLabs.com) is a collection of stock market composite indexes that includes more than six hundreds public trading companies and ADRs with the largest market capitalizations on the NYSE, NASDAQ, AMEX stock exchanges and the OTCBB (Over-The-Counter Bulletin Board). The group of indexes currently contains 634 stocks from 11 sectors categorized into 69 industries, with the composition weight of each component adjusted periodically based on its market capitalization.
In additional to standard pricing and volume data, other financial data and numbers for each sector and industry are also derived and calculated based on the numbers and allocations of its underlying components. For example, the EPS (earning per share) an industry is obtained by summing up the EPS numbers of each component multiplied by number of shares in the holding. This allows investors to benchmark the performance of investment based on specific stock market sectors or industries.
Intraday index pricing and volume data are calculated based on real time market data. Other financial data and characteristics are derived on a daily basis after market close. Subscribed users have access to up-to-date and detailed index data as well as unlimited download of historic numbers and charts.
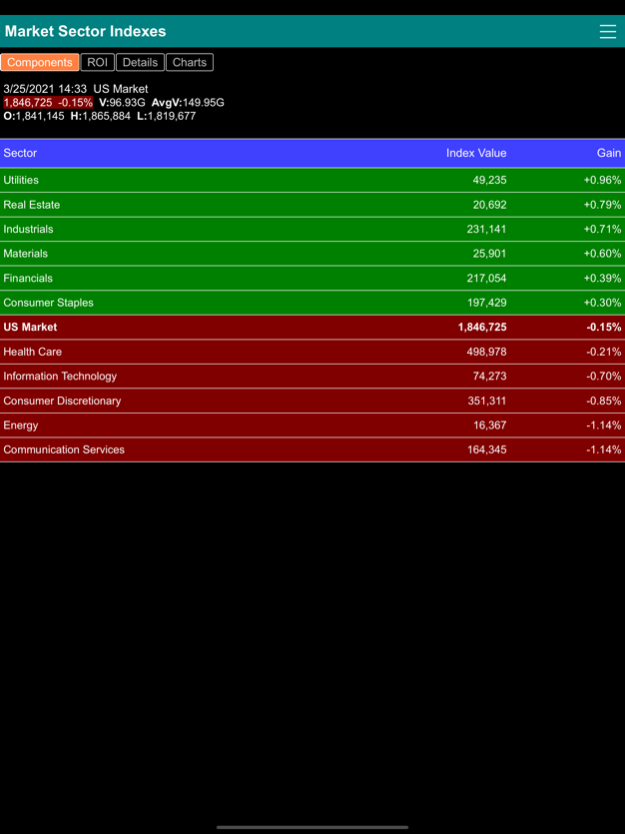
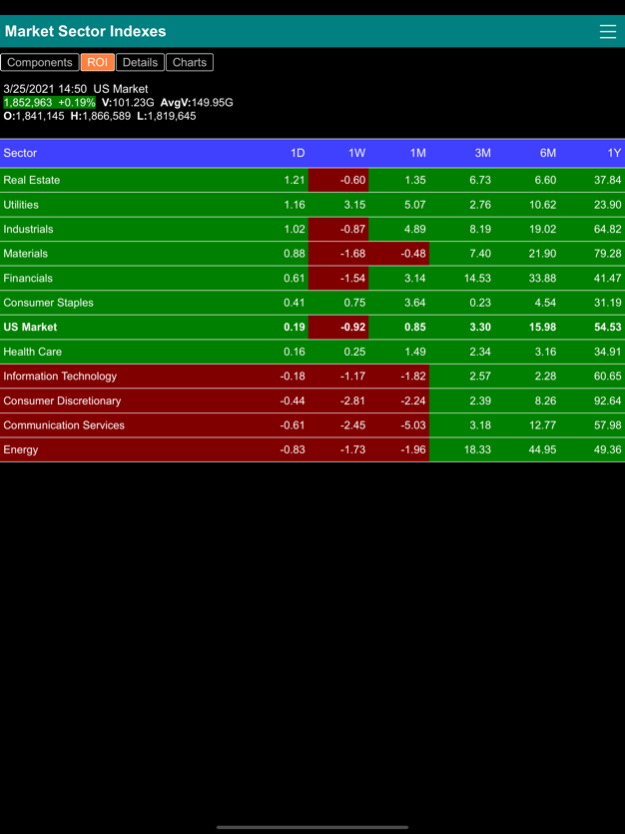
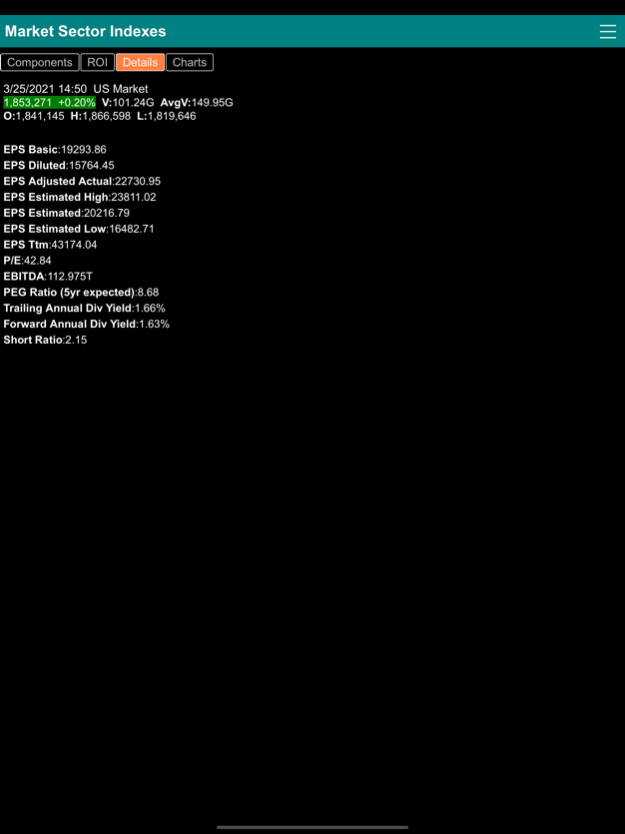
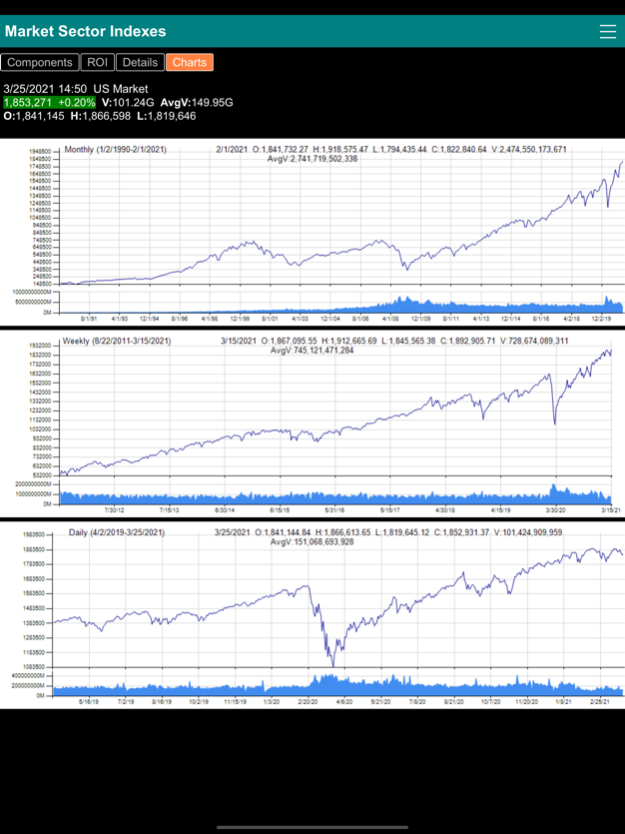
This app includes four types of information for each sector or industry index. The Components screen gives a list of underlying components of the index with prices and gains/losses. The Performance screen shows the list of components of the index with performance data from daily, weekly, monthly, 3-month, 6-month and one year periods. The Details screen gives specific information of each index, including the trading volume, the 52-week average volume, the allocation percentage of the industry within the sector, earning per share (ttm EPS) of the index and the Price to Earning (ttm P/E) of the index. The Graph screen gives the monthly, weekly and daily price chart of the index.
Sector and Industry specific indexes allow investors to benchmark the performance of investment based on specific stock market sectors or industries. Just as all stocks tend to move based on the underlying factors that drive the overall market, stocks in a similar industry tend to move based on underlying factors that affect the industry. One of the most basic methods for understanding the risk of an investment portfolio is to determine its sector breakdown. Is the portfolio spread across different industrial sectors or is it concentrated in just a few? This provides a good indication of how an investment portfolio will respond to macroeconomic factors or industry trends.
Market sector and industry indexes are also essential tools for the Sector Rotation Investment Strategy. A rotation strategy is very similar in approach to tactical asset allocation, but rather than asset classes, the investor will allocate his funds to specific sectors or industries depending on the short-term view. The investor will overweight the sectors or industries that he or she believes will outperform and underweight those expected to underperform.
Mar 26, 2021
Version 2.0
Intraday indexes calculated from real time market data.
New data matrixes for all the indexes including EPS, P/E, short ratio … and much more.
New platform supporting additional matrixes to be added in the future without the need to update the app.
Previous Versions
Here you can find the changelog of Stock Market Sector Indexes since it was posted on our website on 2023-09-05 22:42:48.
The latest version is 2.0 and it was updated on 2024-04-23 08:56:41. See below the changes in each version.
Stock Market Sector Indexes version 2.0
Updated At: 2021-03-26
Changes: Mar 26, 2021
Version 2.0
Intraday indexes calculated from real time market data.
New data matrixes for all the indexes including EPS, P/E, short ratio … and much more.
New platform supporting additional matrixes to be added in the future without the need to update the app.
Disclaimer
Official App Store Link
We do not host Stock Market Sector Indexes on our servers. We did not scan it for viruses, adware, spyware or other type of malware. This app is hosted by Apple and passed their terms and conditions to be listed there. We recommend caution when installing it.
The App Store link for Stock Market Sector Indexes is provided to you by apps112.com without any warranties, representations or guarantees of any kind, so access it at your own risk.
If you have questions regarding this particular app contact the publisher directly. For questions about the functionalities of apps112.com contact us.